Applied Analytics Practicum
2024/09-2024/12 Python PowerBI Time Series Analysis
Basic Info
This is the practicum project I did in OMSA, partnered with Ziyang Guo, supervised by MedTrans Go.
The Task
Our task is to analyze tech update text logs (these are given in the form of websites and google docs), as well as request records (in the form of a csv file with a data dictionary), quantifying impact of tech udpates on sales, as well as doing seasonality, trend detections on sales.
My contributions
| Components | Implementation | Role |
|---|---|---|
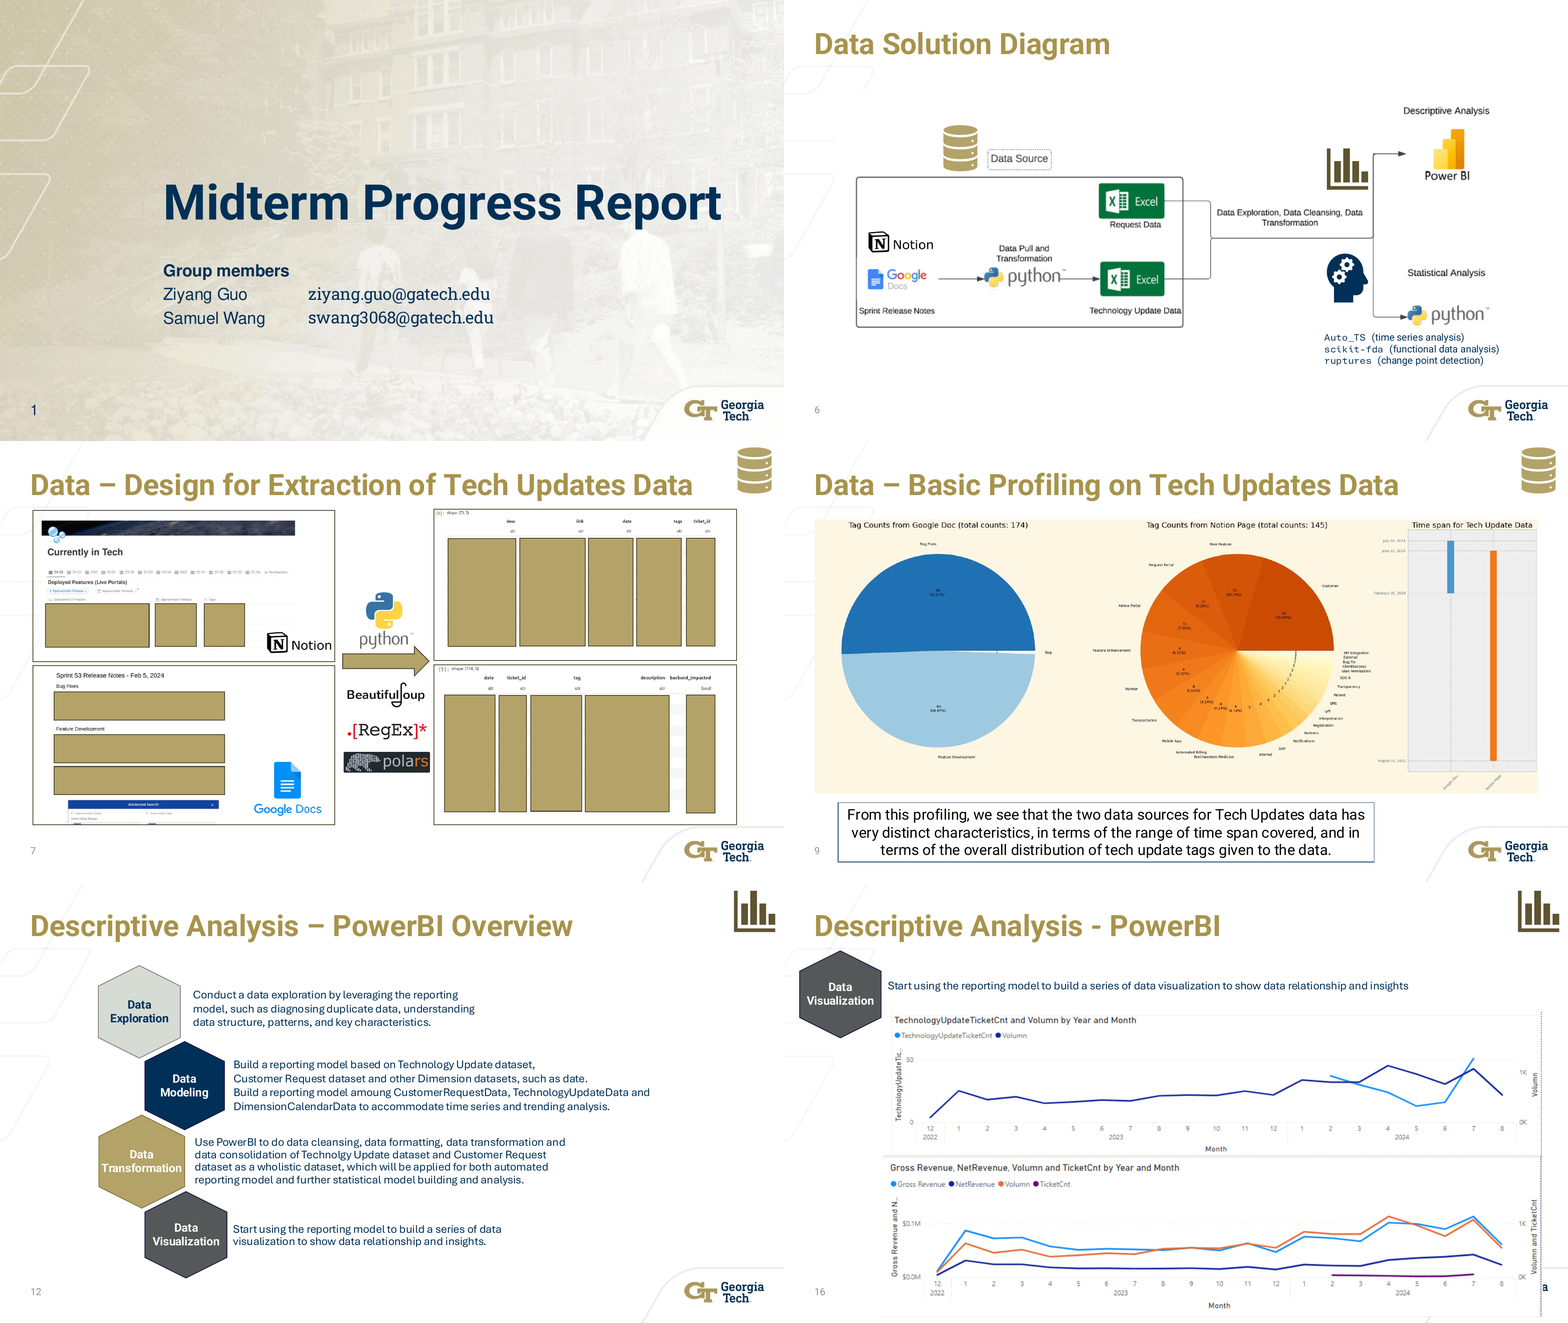
| Text Extraction | bs4, re | Designed scripts for extraction and tabulation of relevant data from webpage and Google docs |
| Data Wrangling | polars | Aggregate, filter, and ran basic diagnosis on data |
| Dashboard | PowerBI, matplotlib | Prepared data for Ziyang to build the dashboard, generated other preliminary visualizations with matplotlib |
| Descriptive Analysis | PowerBI | None |
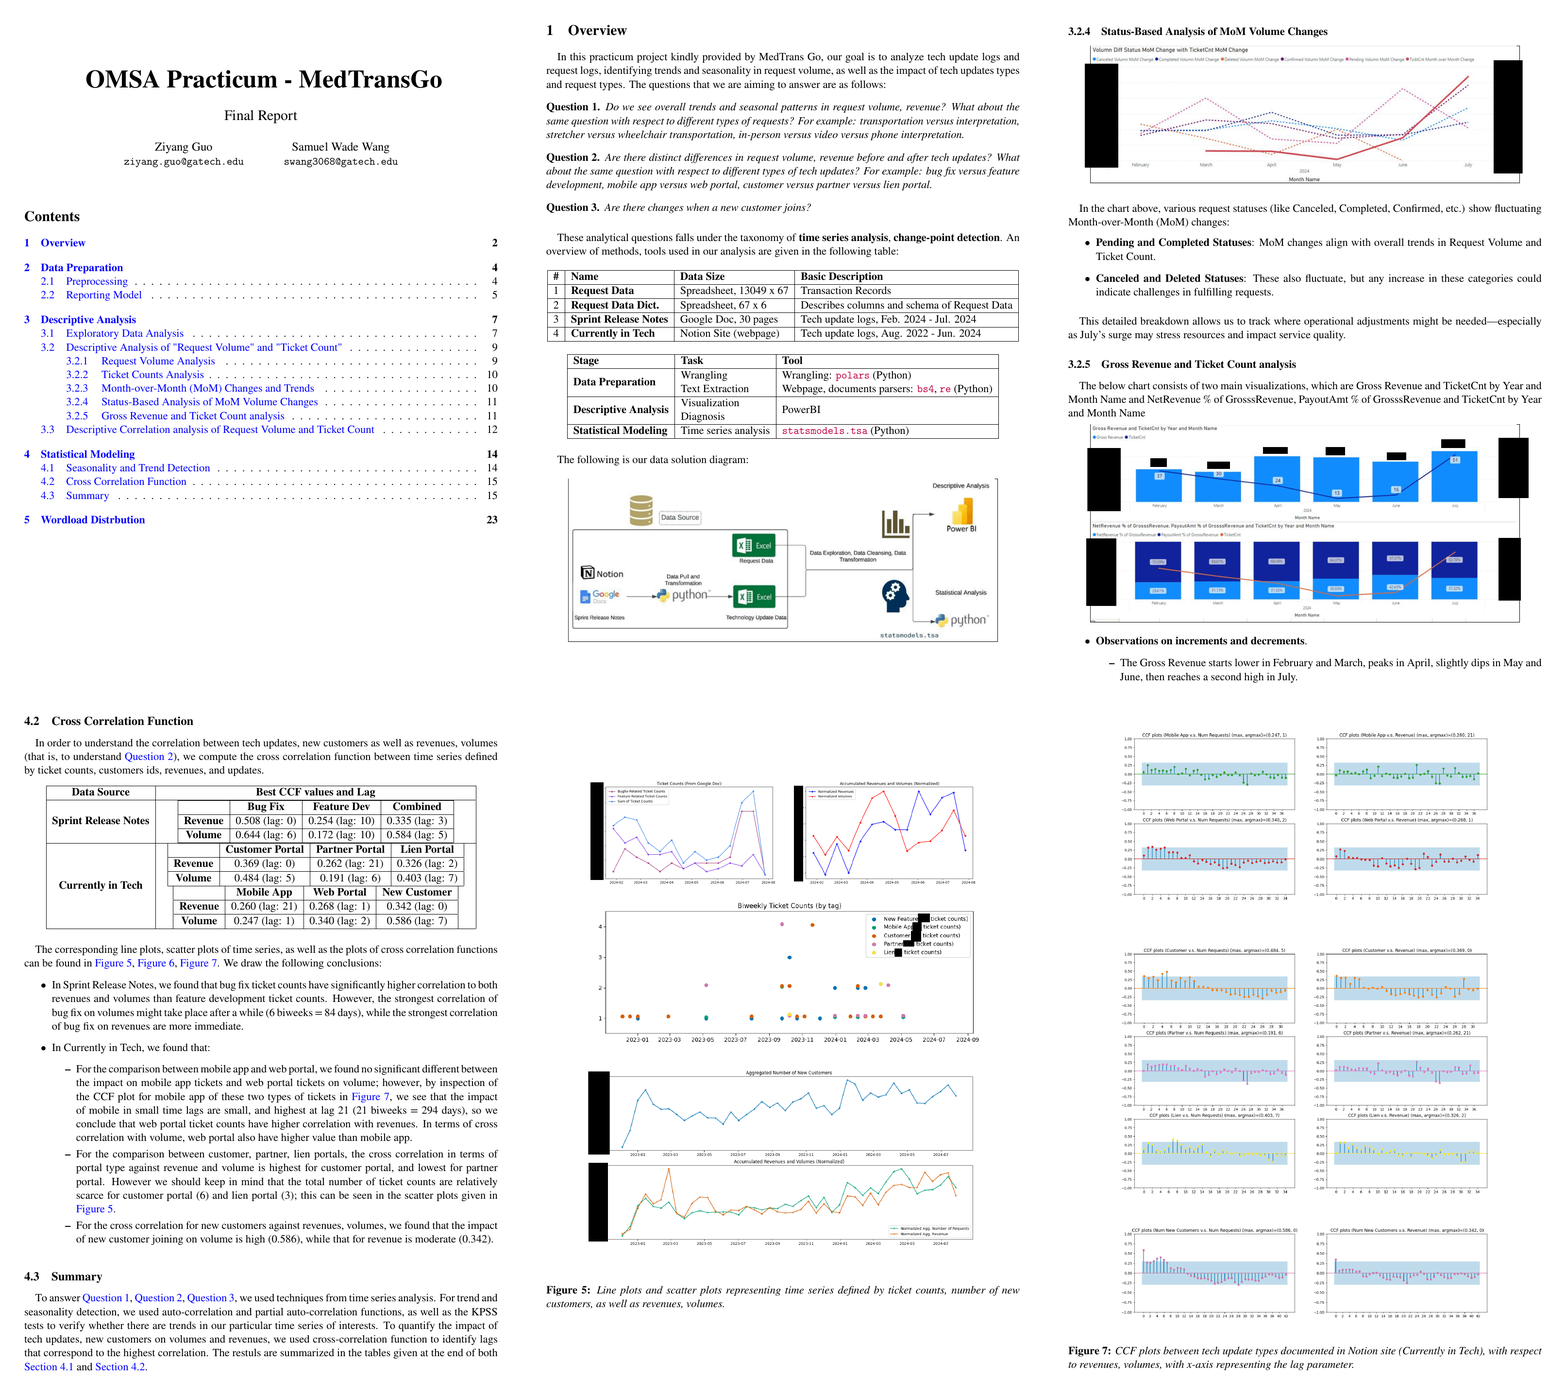
| Modeling | statsmodels.tsa | Use ACF, PACF, CCF functions and KPSS tests for trend, seasonality detection, correlation analysis of time series |
| Reporting | MS PPT,
| Collaborated on a slidedeck for progress report; Combined and typesetted teammates inputs into a
|
Some Screenshots
Final Comments
I feel like this project is the closest to an end-to-end data analytics project in this program. The experience working directly with and under other analytics professionals is also valuable. The first time I saw PowerBI in action absolutely amazed me (sadly it does not natively supports Linux).
Although learning about nerdy time series models and statistical knowledges along the way of this project are also very fun to me, I think one of the most exciting aspect of this project for me is that the result of this project can directly help people from the corporation - such as insights in to which types of tech updates have been the most impactful, or the characteristics of the requests data.

